
U.S. elections seems to drag on and on, especially when compared to Canadian federal elections. Fortunately, the U.S. election only comes around every four years.
Looking at world markets, the U.S. election is far more important to follow than our own Canadian elections. The United States represents 42 per cent of the world’s market capitalization, while Canada represents less than three per cent. Our clients also hold more U.S. and international investments than Canadian investments.
It is important to monitor the news south of our border as we approach the next election on Nov. 5, 2024.
Every four years, including during the lead-up to the last election on Nov. 3, 2020, we field many phone calls and have many meetings about the direction the stock market might go under a Republican or Democratic president.
Having lived many years in the United States in my 20s, it became very apparent that Americans support a party first and foremost — more so than the candidate. We have not felt that this concept is as strong here in Canada. Many Canadians may have a bias, but they are certainly open to hearing what each candidate has to say.
Leading right up to election day, the polls will try to predict who will be victorious. Regardless of who is elected U.S. president, our prediction is that the stock market will keep chugging along, with periods of volatility, and positive performance over time.
As much as some will try to predict the stock market movement, this is all very much short-term thinking and deviates from the long-term investment approach that has proven so successful over time.
Every four years, we publish the results of the stock market over time during election years, along with the price return during the election year. As of Sept. 27, 2024, the total return year to date for the S&P 500 stock market is 21.55 per cent.
S&P 500 stock market returns during election years
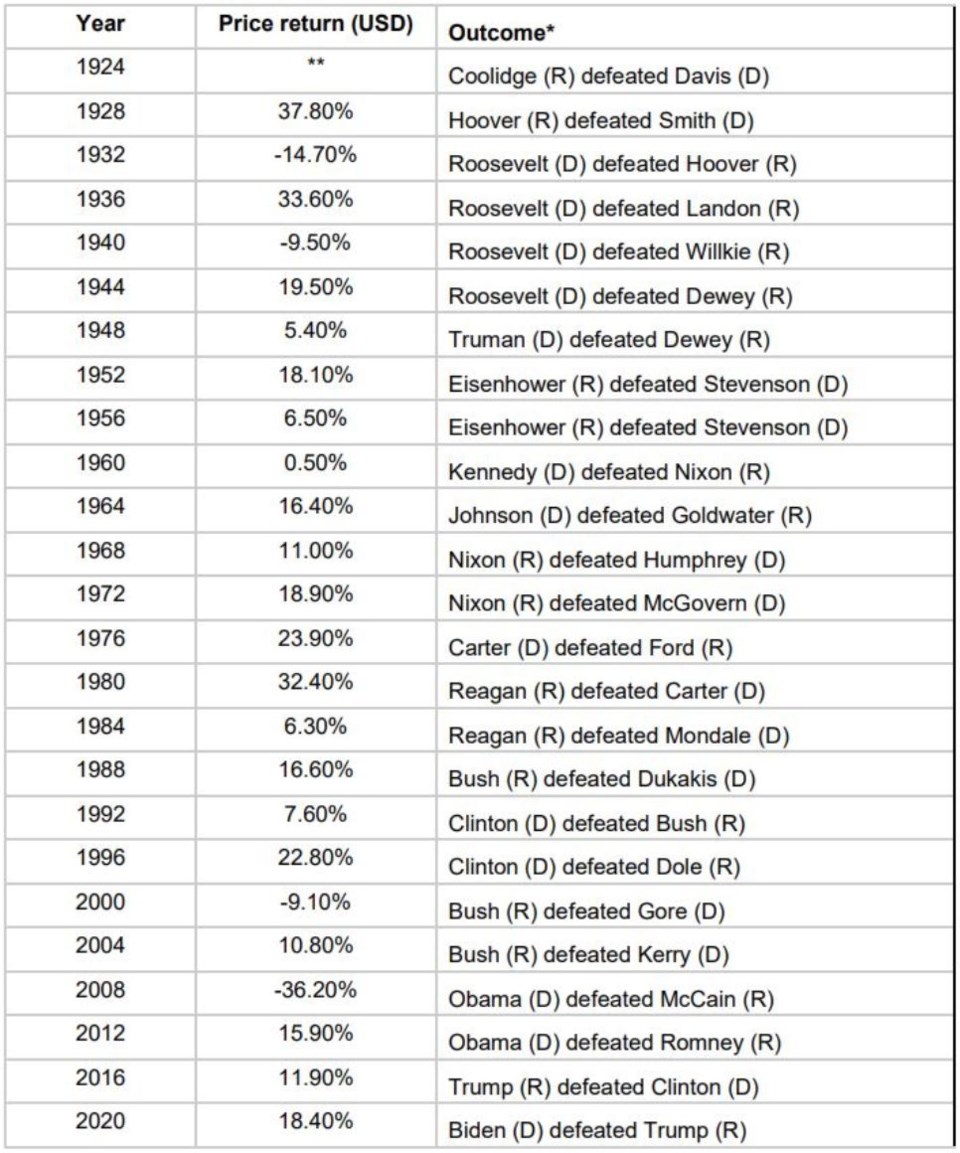
* R = Republican, D = Democrat
** Information not available
Source: Bloomberg
The above historical data shows that in the last 100 years, the split between Republican and Democratic leadership is almost equal, with Democrats slightly ahead in the victory count and number of years in office. Over the past 100 years, once the Republicans or Democrats obtained office, in most cases they were also successful in winning a consecutive term.
Over the years, many articles and theories have been put forward regarding the stock market in relationship to presidential terms. Certainly, lots of historical data exists on how the stock market typically performs in the first, second, third or final year of a president’s term. Generally, the final two years are better than the first two years. The above shows that, in the past 24 election years, the S&P 500 was positive in 20 of those years (or 83 per cent).
We caution all investors not to rely on historical data such as this to make investment decisions. Although the odds may lean toward these patterns continuing, it is not a sound way to make investment decisions.
The purpose of this article is to give a few statistics as an additional factor to consider when making investment decisions. There are too many other factors to consider in putting all the emphasis on historical patterns.
Only four election-year declines in 100 years
As we showed above, election years have historically been positive years for the markets. Intuitively, this makes sense as the incumbent administration pulls out all the stops to retain power.
Data going back nearly 100 years show that presidential election years are the second-best performing year of the four-year cycle, trailing only the pre-election year.
In election years where the market produced a decline (four out of 24 election years, or 16.67 per cent), incumbent parties lost power in three of those years (1932, 2000 and 2008).
If you look at all years — not just election years — for the S&P 500 index, over nearly 100 years the market posts a negative result about 27 per cent of the time.
As you can see, the election year sample produced a better result, but in both cases the stock market produces many more positive years than it does negative years. This is the point we always tell our clients to focus on.
‘Presidential predictor’ indicator
We learned of a rather fun statistic called the “presidential predictor” (coined by the chief investment strategist at CFRA Investment Research) that looks at the relationship between stock market performance between July 31 and Oct. 31 of an election year and which party gains power come November.
The information we found goes back to 1936 and shows that when the S&P 500 is up from July 31 to Oct. 31, the incumbent party retains power 85 per cent of the time.
In instances where the S&P 500 was down during this span, there has largely been a shift in power (89 per cent of the time).
The times when this indicator has missed the mark has been attributable to a significant third-party candidate, or some exogenous shock usually linked to war.
Levers pulled to stay in power
Incumbent governments will pull all the levers available to help them retain power. Historically, the fiscal measures used by governments to stay in power have had the aim of stimulating a sense of well-being amongst voters. These measures include increases in federal budget deficits, government spending, and social security benefits, which all have the goal of increasing real per capita disposable income.
Take, for example, the administration of George W. Bush administration, which awarded federal grants to strategically important states in a bid for re-election (2004). The Obama administration, after a significant midterm loss, introduced and passed the 2010 Tax Relief Act (which overcame opposition from both parties).
Regardless of which levers are pulled, and who retains or wins power, our advice to clients every four years is always the same: No matter who wins, odds are better than not that the stock market will continue doing what it has always done.
As a Portfolio Manager, our job is to focus on the big picture, which we feel is to buy high-quality companies that have dependable and diverse operations around the world, and a history of weathering the storm.
Kevin Greenard CPA CA FMA CFP CIM is a Senior Wealth Advisor and Portfolio Manager, Wealth Management with The Greenard Group at Scotia Wealth Management in Victoria. His column appears every week at timescolonist.com. Call 250-389-2138, email [email protected], or visit greenardgroup.com.

