
Our preference has always been to purchase direct equity holdings, as opposed to recommending exchange traded funds and mutual funds.
Exchange traded funds (ETFs) are lower cost than mutual funds, but both have embedded fees. When purchasing direct holdings there are no embedded fees. The best part of purchasing direct holdings is the ability to control the number of equity positions within the portfolio and the position size of each holding.
The S&P 500 Index that is often quoted on television is a market capitalization weighted index. There are many different types of ETFs, including various index ETFs, so it is important to know which ETF you are buying.
Some ETFs may be equal weighted meaning that they have the same weighting in each company. Other ETFs are market capitalization weighted which would more closely replicate the S&P 500 Index.
Examples of S&P 500 Index market capitalization weighted ETFs are SPDR S&P 500 ETF Trust (SPY-US), Ishares Core S&P 500 ETF (IVV-US), and Vanguard S&P 500 ETF(VOO-US).
S&P 500 ETF components
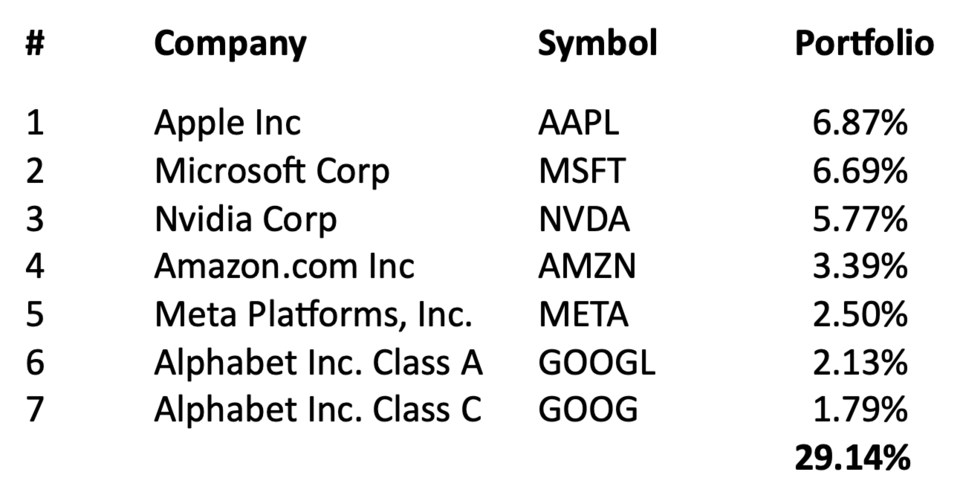
Market weighted ETF option for investors
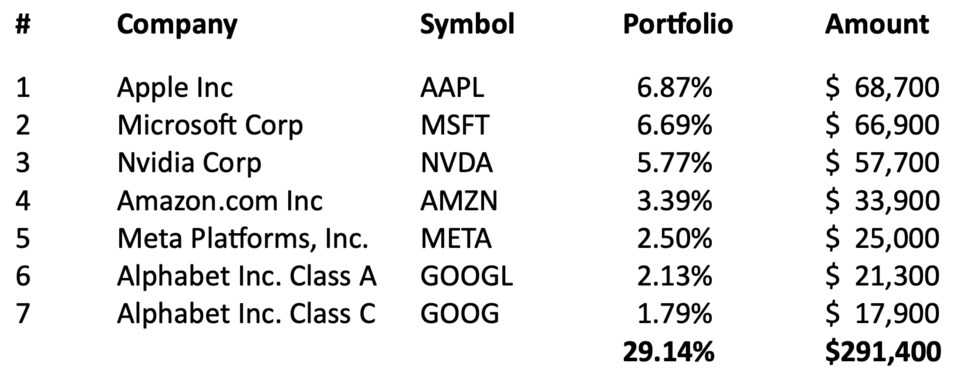
If an investor had $1 million and chose a market capitalization weighted ETF, such as the SPDR S&P 500 ETF Trust (SPY-US), this investor would essentially own 500 companies, but the dollars would be concentrated in a smaller group of names. Of the $1,000,000 invested in the SPY-US, $291,400 would be invested in just 6 companies (two classes of Alphabet Inc. shares).
Direct holdings
We do not like the idea of holding hundreds of names. With the direct holdings approach we focus on buying only the highest quality names. Many mutual funds will have 100 to 200 names and some ETFs will have 1,000 names. When you have a market capitalization weighted ETF, such as the S&P 500 ETFs noted above, you have the extremes of a handful of positions being overweight, combined with hundreds of other positions that are underweight. When we are mapping out our optimal risk adjusted portfolios, we explain how we must balance the benefits of concentrating versus reducing risk through diversification.
The Greenard Group – Growth Model Portfolio
Our growth model portfolio is 100 per cent equities. On a $1 million portfolio, we would recommend 32 direct equity holdings. When initially purchasing full positions, each position would be approximately 3.125 per cent. Examples of our top seven holdings (out of 32) in The Greenard Group – Growth Model Portfolio are:

Based on the initial purchase amounts, you will note that our top seven positions represent 21.88 per cent, or $218,750 of the initial invested amount. The top seven positions within the ETF are 29.14 per cent, or $291,400 of the initial amount invested.
After the original purchase of The Greenard Group – Growth Model Portfolio holdings, the weightings within each stock will either increase or decrease relative to the overall portfolio. Over time, it is natural for some positions to increase more than others. At that point it is a discussion on whether to overweight individual position(s) relative to the optimal weighting of 3.125 per cent or rebalance (trim the position).
No position in The Greenard Group – Growth Model Portfolio exceeds 5 per cent unless we have discussed overweighting the position(s) with our clients, and they consent to incurring additional risk to overweight specific names within the portfolio. Currently our model portfolio is overweight names like Microsoft, Apple, and Costco. What is interesting is that the person who purchases SPY-US with their funds would immediately have three positions that exceed the five per cent threshold.
Concentration can skew returns
The S&P 500 Index’s price return is 11.52 per cent year-to-date (from January 1, 2024, to August 8, 2024). This percentage can be a bit misleading given the concentration within the Index. Rather than focus on the percentage, we can also look at the number of points the index has increased year to date.
S&P 500 Index starting level: 4,769.83
S&P 500 Index closing level (August 8, 2024): 5,319.31
Change in points: 549.48
Below is a summary of data pulled from Bloomberg that shows the top contributors, in points, to the S&P Index up to Aug. 8, 2024.
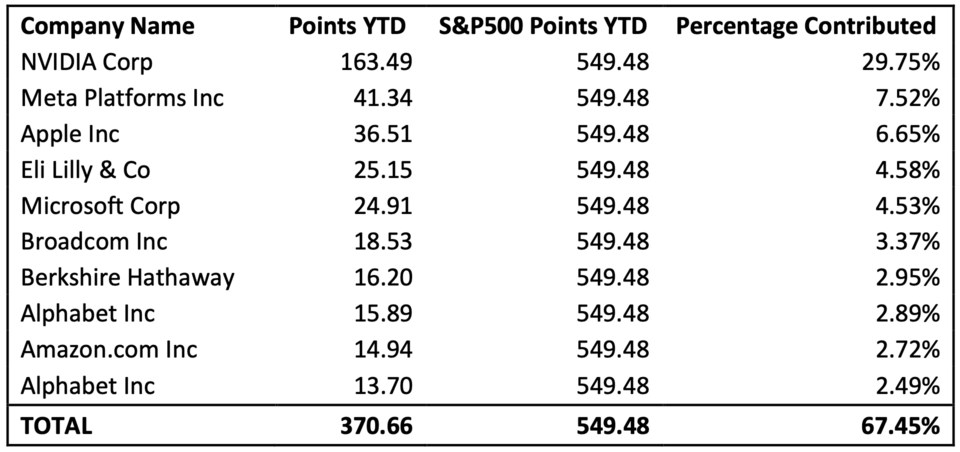
As you can see from the Bloomberg data, of the 549.48 points the Index has climbed year-to-date the top 10 names are responsible for 67.45 per cent of the market gains, or 7.77 per cent of the 11.52 per cent total return. Nvidia has driven a disproportionate percentage of the market gains year to date, contributing 29.75 per cent of the overall total return.
Backing out the top 10 point contributors
When you back out the top 10 point contributors, you are left with 178.82 points contributed by 490 companies which are responsible for 32.55 per cent of the Index return, or 3.75 per cent of the 11.52 per cent total. Therefore, if you had not owned the best 10 performing stocks in the index, you would have experienced a significantly different return and likely one that was much less attractive.
Equal weighted S&P 500 Index
If you consider the equal weighted S&P500 Index, which weighs all stock constituents the same and frequently rebalances the portfolio to maintain the equal weighting, the year-to-date price return is 5.27 per cent relative to 11.52 per cent for the market capitalization weighted Index. This stark comparison makes the case for owning the best companies within the Index that offer the most intriguing return prospects and avoiding those companies that have less attractive characteristics.
Focusing on contributions, not fads
We see far too many do-it-yourself investors lose money through speculative trades and getting emotional (buying and selling at the wrong time in the market cycle). By speculating we mean buying smaller capitalized companies, emerging markets, commodities, derivatives, or trying to market time (frequent trading). Creating a focus on regular savings / contributions to investments and staying invested through the bumps is key to building wealth over time.
Portfolio Management with direct holdings
Our preference is for investors to have a professionally managed portfolio with a Portfolio Manager. This is different than a managed account that is managed by a third party. If you have a direct relationship with a Portfolio Manager, you can negotiate fees and keep the cost of investing to a minimum. In addition, tax consequences and placement of investments can be factored in when direct holdings are purchased which can not be factored in with ETF investments. Our model portfolio concentrates with 32 holdings, not 500 holdings. Our maximum positions are not as large as the largest positions in a market weighted index, and we eliminate what we believe to be the worst 468 positions by having a zero weighting to those names.
Kevin Greenard CPA CA FMA CFP CIM is a Senior Wealth Advisor and Portfolio Manager, Wealth Management with The Greenard Group at Scotia Wealth Management in Victoria. His column appears every week at timescolonist.com. Call 250.389.2138, email [email protected], or visit greenardgroup.com.
